We wanted to understand which approach works better when it comes to allocating resources in a property portfolio, so we did a little experimenting. Our initial inquiry was, “How much would the Portfolio Intelligence Platform have helped investors during the COVID crisis?” but asking such an open-ended question is nearly impossible to answer, so we narrowed it down to “What would be the difference in returns in 2020 if we used the Portfolio Intelligence Platform versus just choosing according to the greatest expected returns?”. As expected, the Portfolio Platform outperformed simple allocation by expected returns, but the extent of the difference was striking. The Portfolio Intelligence Platform outperformed by 3.5% – a significant amount considering that’s $35M for a $1B portfolio.
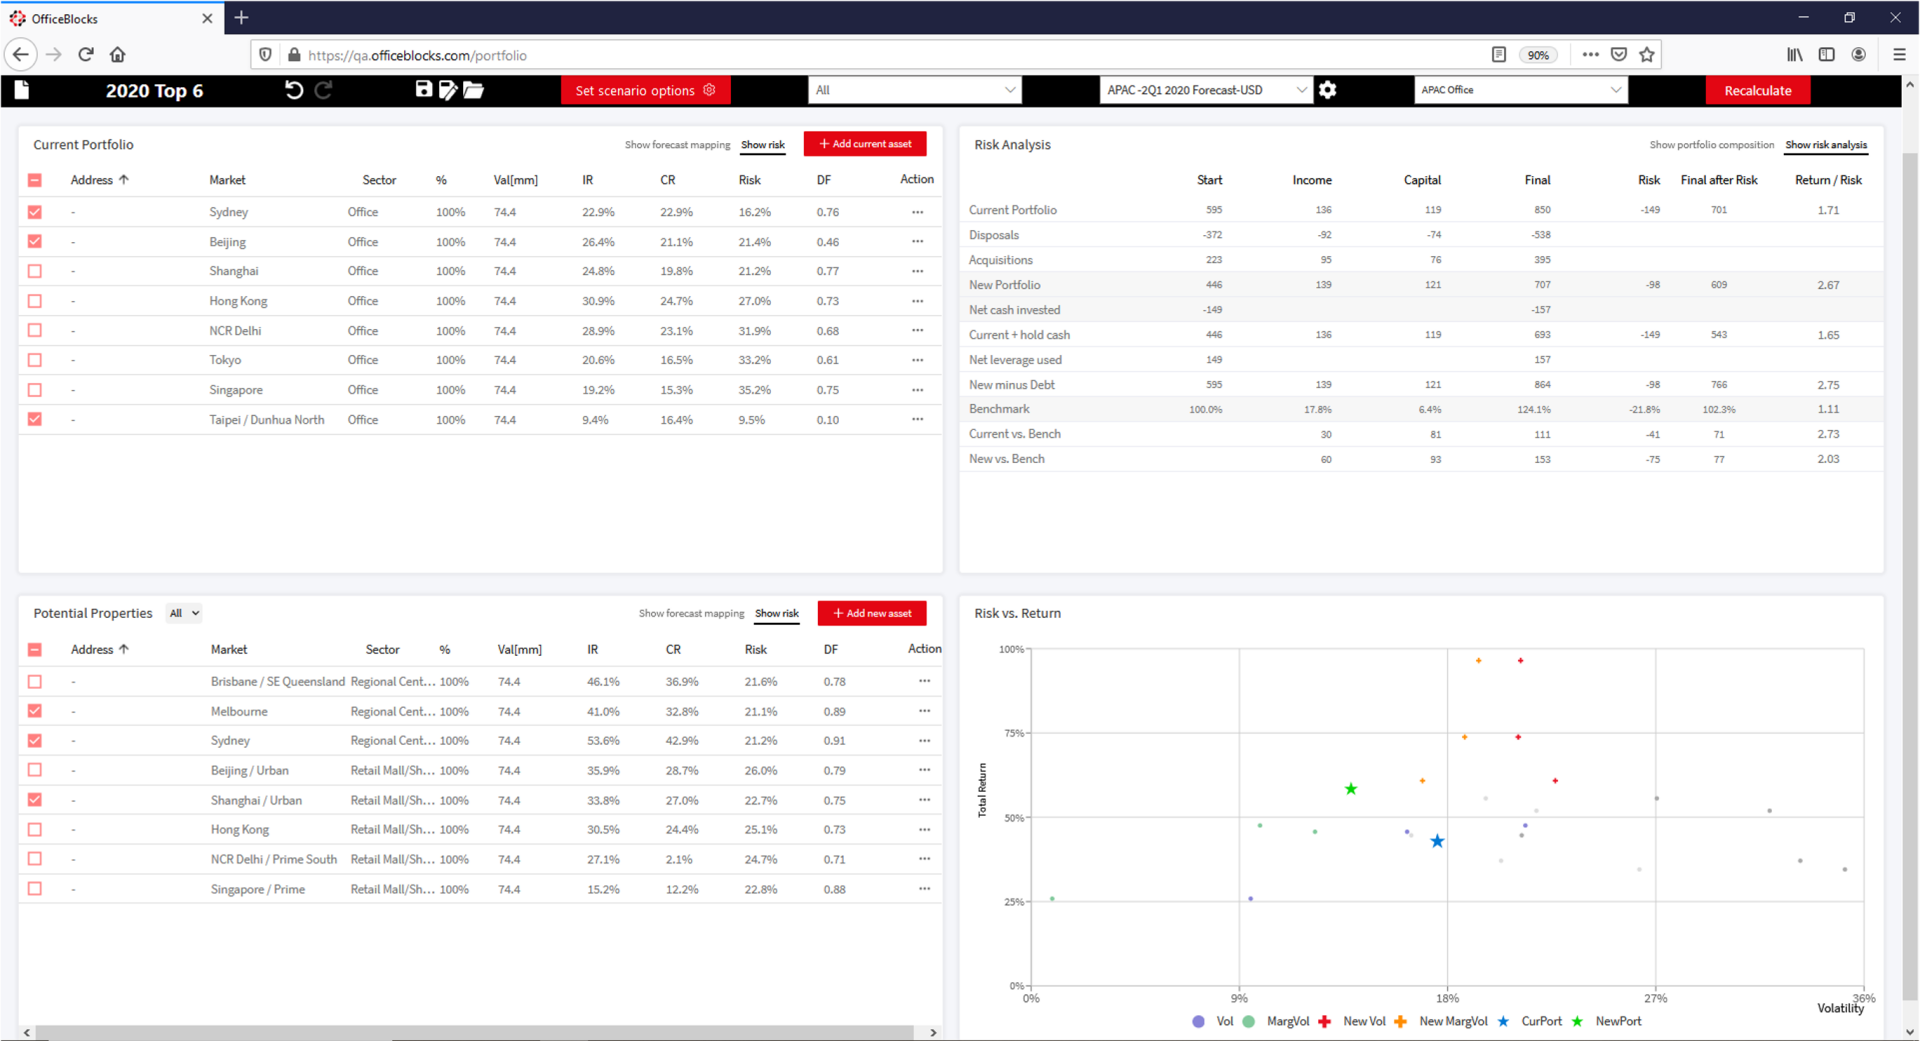
So how was the experiment conducted? We looked at a total of 16 potential office and retail assets across cities in APAC and proceeded to identify the “top six” for a control group and the “top six” for the experiment group.
The first selection – i.e. the control – consisted of six properties that, in January 2020, would yield the highest forecast total returns over the next three years. These properties all turned out to be in retail and spread across Sydney, Brisbane, Melbourne, Delhi, Beijing, and Shanghai.
For the second selection – i.e. the variable – we included the six properties that, when combined, the Portfolio Intelligence Platform indicated would drive the highest return/risk ratio over the next three years. This turned out to be a mix of offices in Sydney, Beijing, and Taipei and retail spaces in Melbourne, Sydney, and Shanghai.
Below are the risk and return statistics for the two portfolios, along with a graph of the individual asset’s performance relative to the efficient frontier.
Now, looking back at the actual performance of each portfolio, we see that the control group, which was based purely on forecasts, gave a return of 1.5%, whereas the more diversified portfolio, the variable, gave a return of 5%.
This is a stylized experiment, and no investor would or should ever choose to build such an undiversified portfolio based solely on the expected returns, but it does offer a solid argument as to why one must take into account the risk and diversification between assets – as well as the return.
It’s also worth considering that the benefit of including risk and diversification into the mix is that the investor can identify markets which are good for their portfolio and benchmarks but isn’t necessarily chasing the high-forecast but also highly crowded markets.
For a deeper look at how the Portfolio Intelligence Platform can help guide your strategic planning and approval of new investments, simply contact us here and our team will get in touch.
